

Session analytics
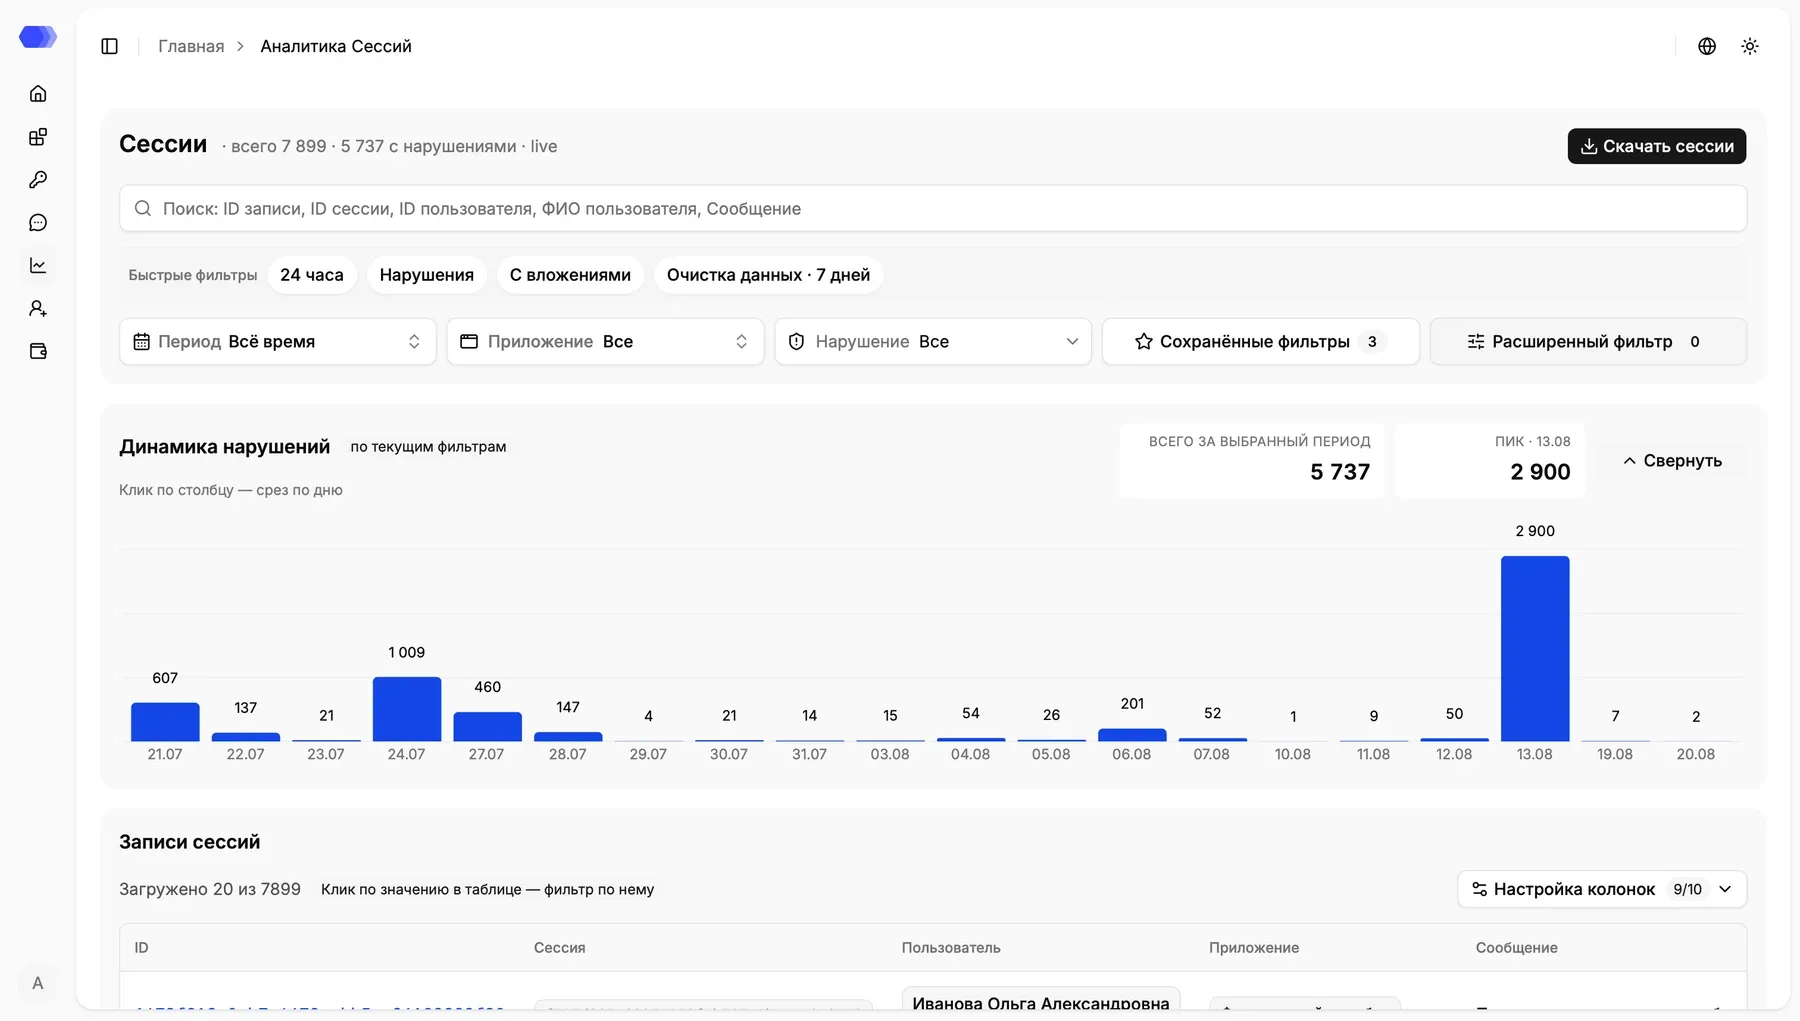
Session analytics is a workspace for investigating requests, model responses, violations, files, and tool calls. Header counters show all records and records with violations; live indicates streaming updates.
Search and export
Section titled “Search and export”Global search covers full record ID, session ID, user ID or name, and message text. Enter 3–256 characters; use the advanced filter for an exact UUID. Download sessions exports the current filtered result. Verify period, application, and filters because the file can contain original messages and personal data.
Quick filters
Section titled “Quick filters”- 24 hours — records from the latest day;
- Violations — records with at least one violation;
- With attachments — records containing files;
- Data cleansing · 7 days — DataClean violations from the latest seven days.
Period
Section titled “Period”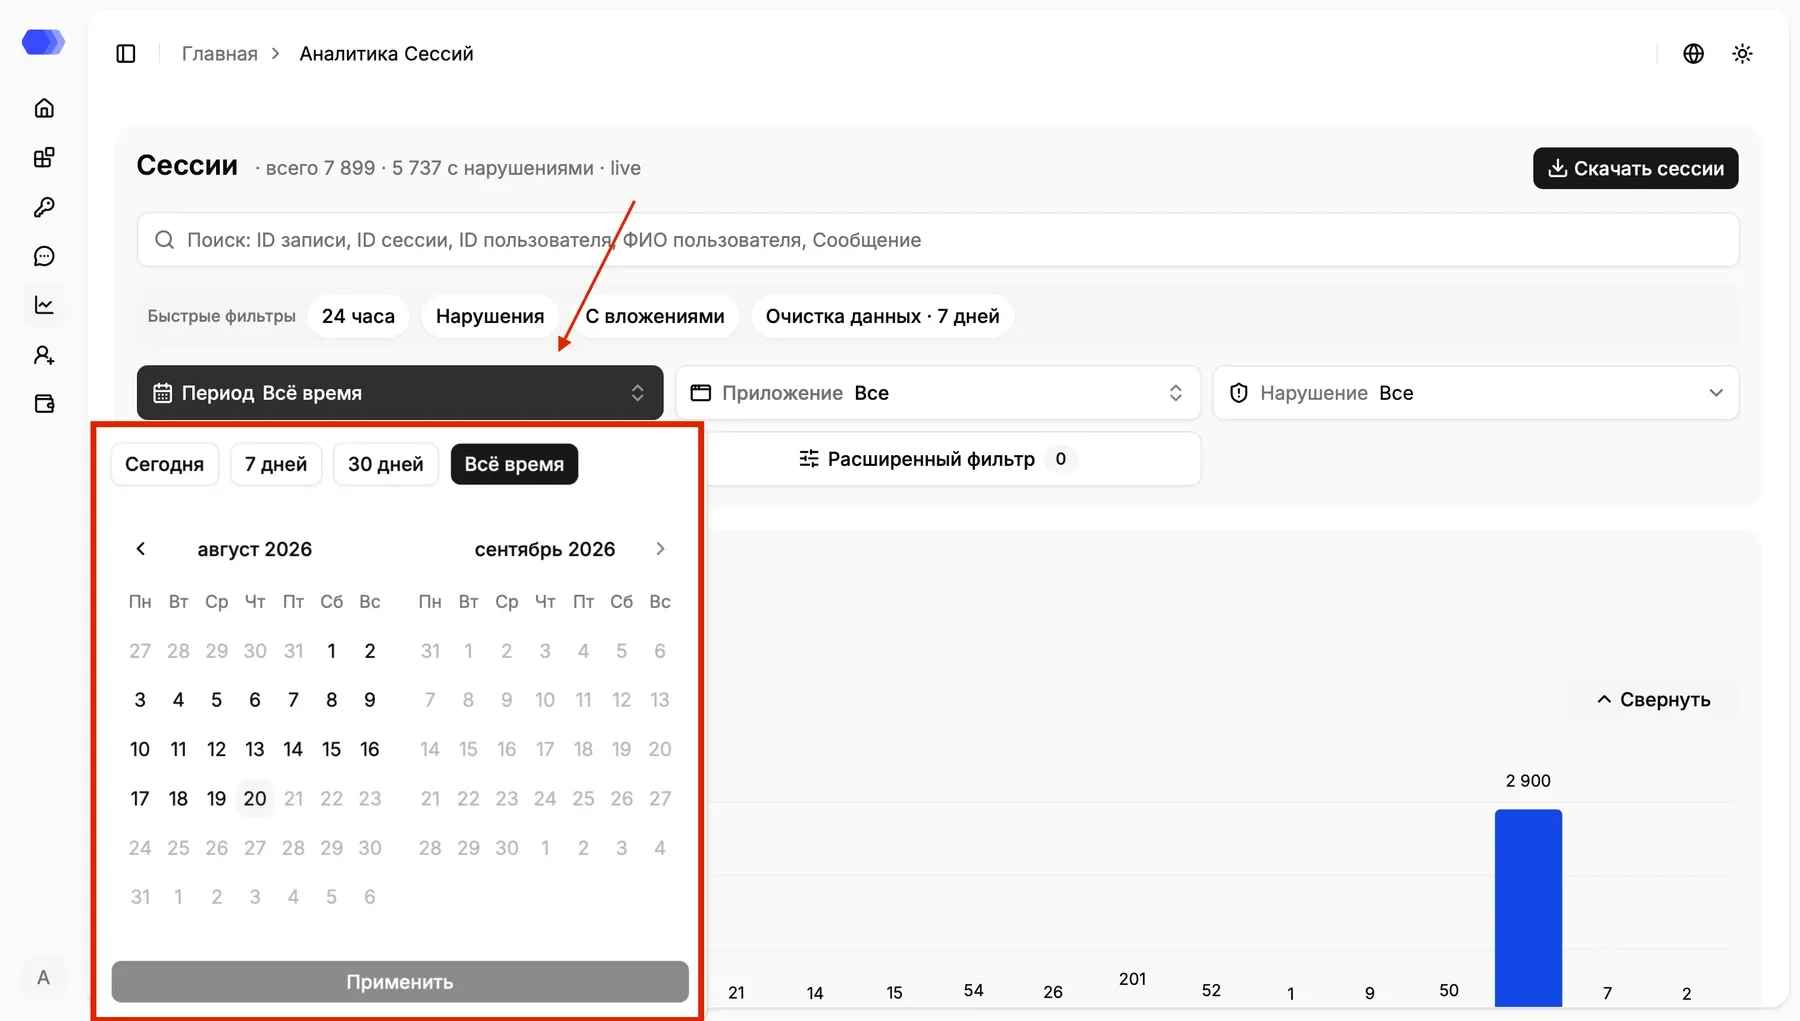
Choose Today, 7 days, 30 days, All time, or a custom calendar range. Month arrows navigate the calendar. Select both boundaries and then Apply. Future dates are disabled.
Application
Section titled “Application”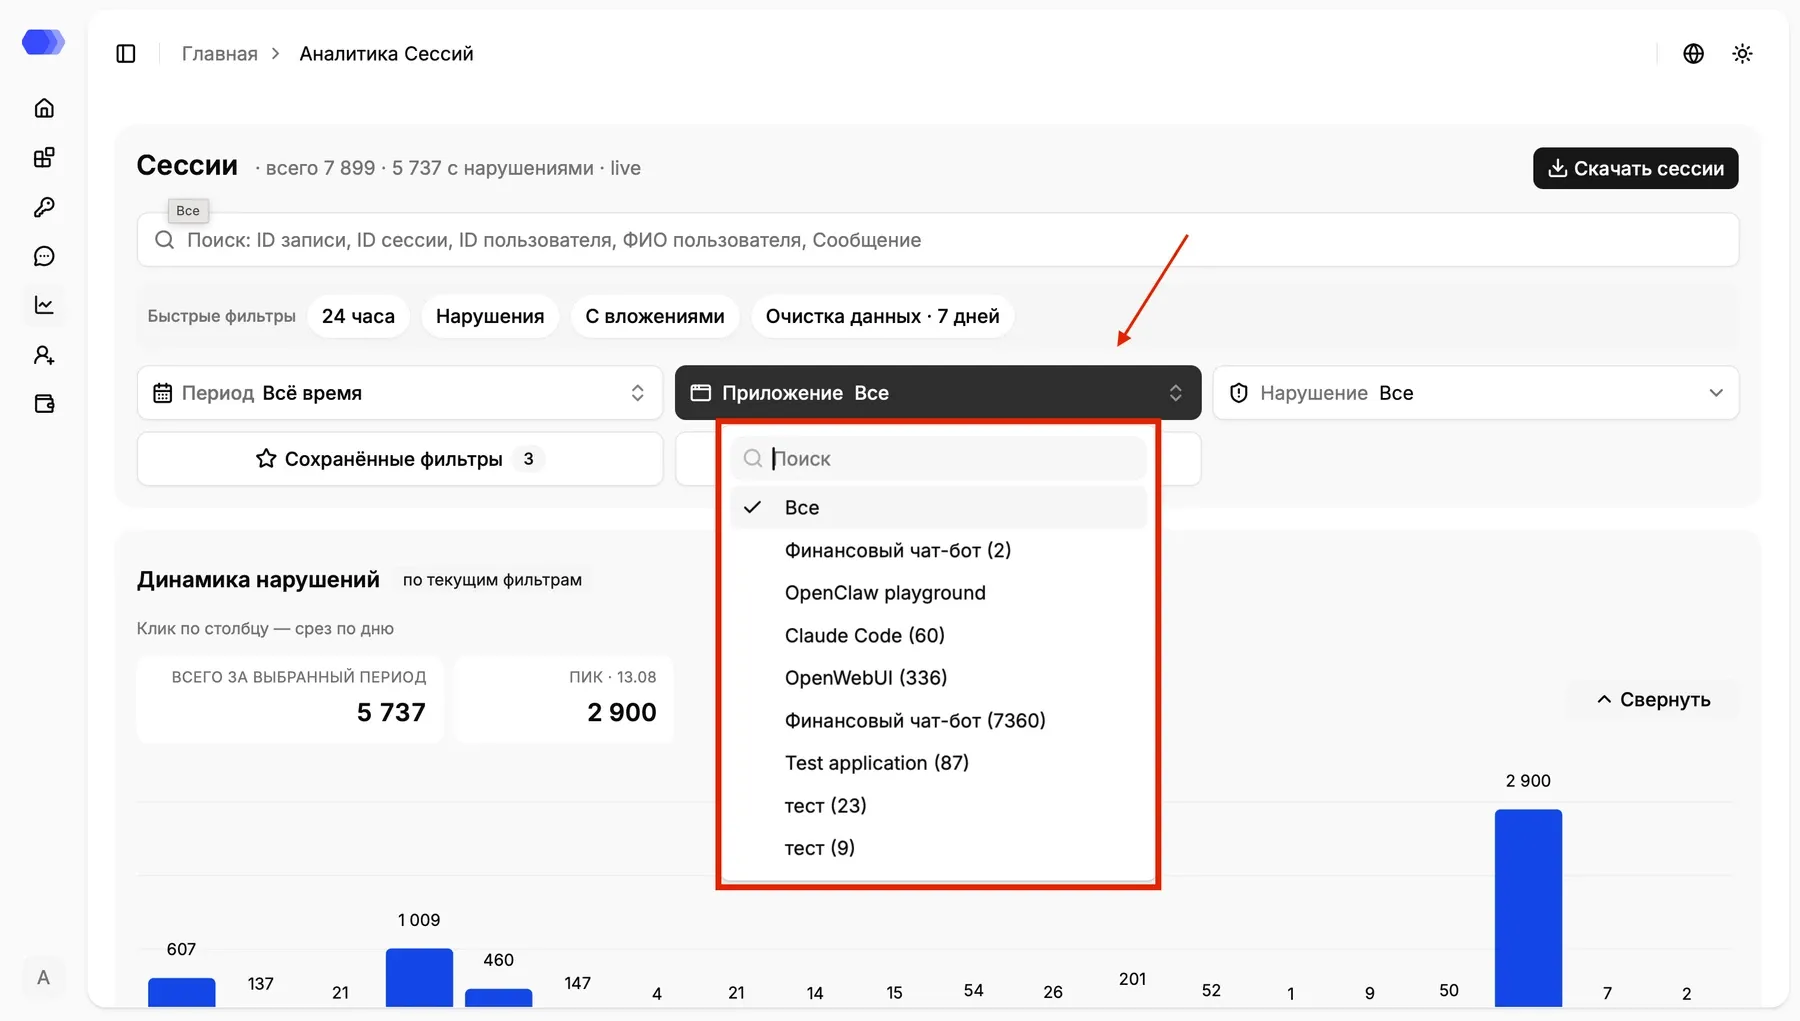
The list shows applications and matching-record counts in parentheses. Search narrows the list. All removes the application restriction; selecting an application updates both chart and table.
Violation
Section titled “Violation”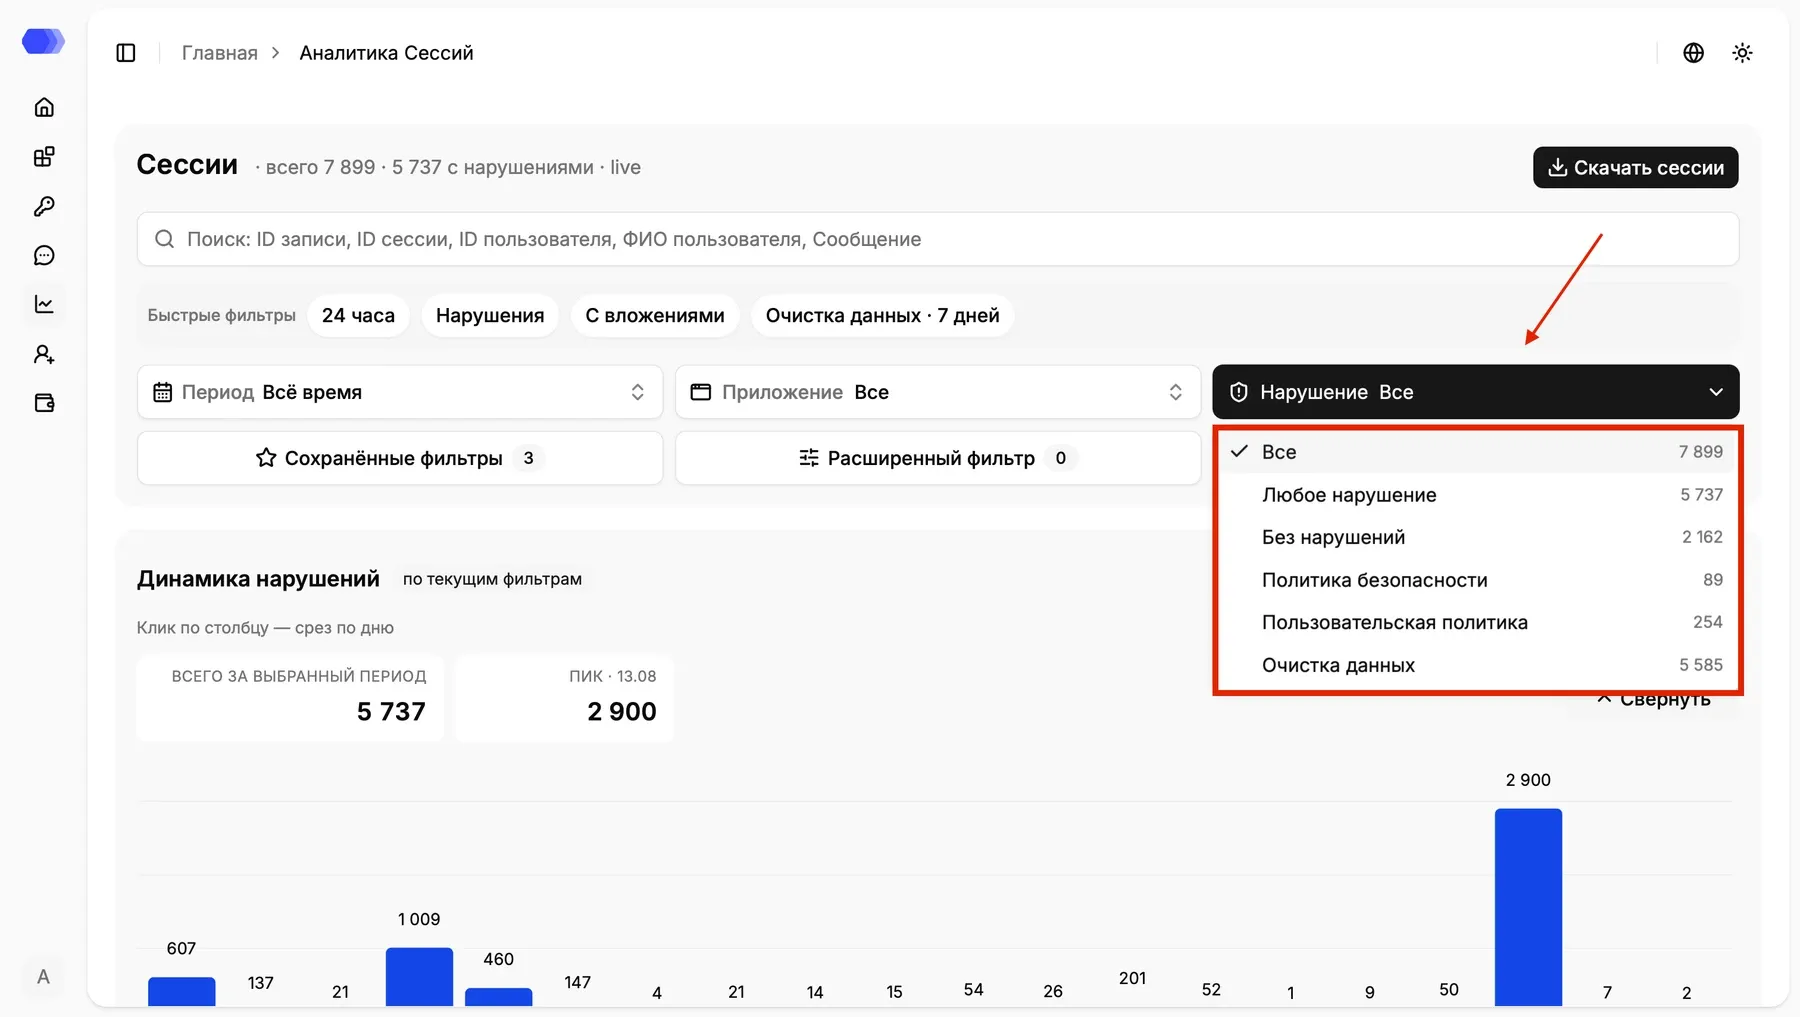
Options are All, Any violation, No violations, Safety policy (Guardrail), Custom policy, and Data cleansing. The number on the right is the matching count for the current selection.
Saved filters
Section titled “Saved filters”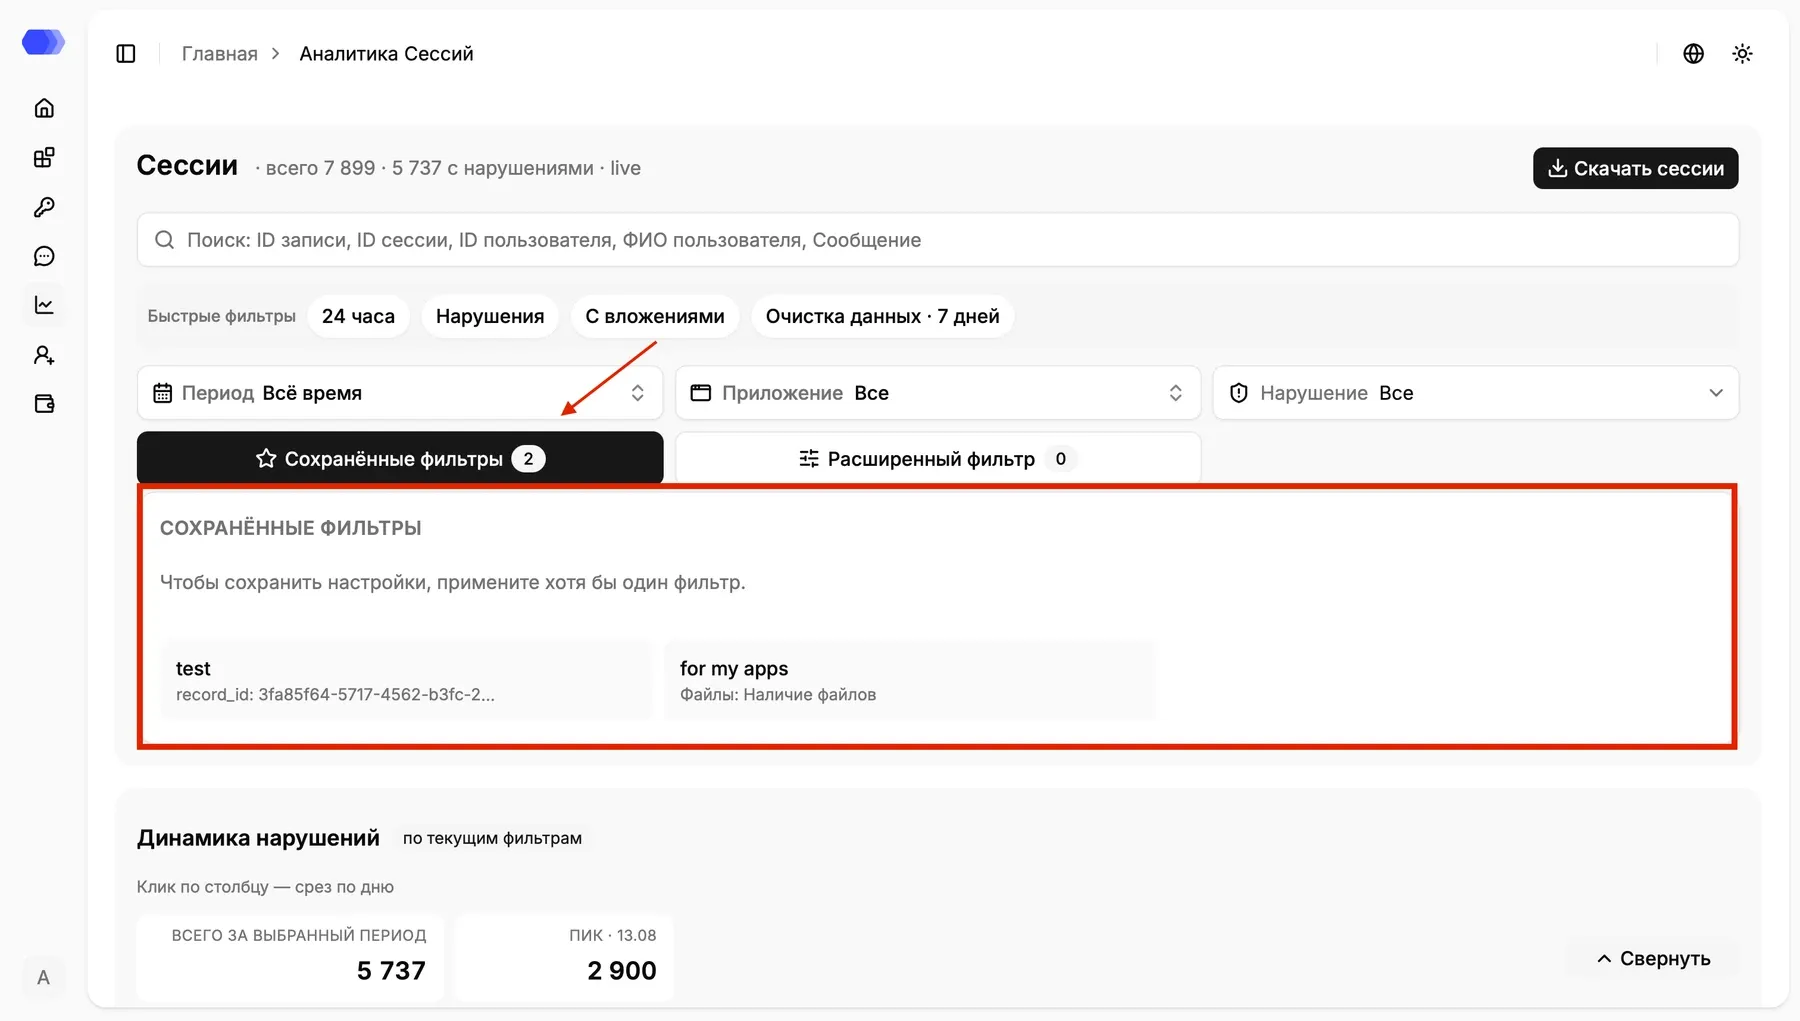
This section stores named condition sets; the button badge is their count. Apply at least one filter before saving. Selecting a card reapplies its conditions. Available set actions let you rename, update from the current conditions, or delete it.
Advanced filter
Section titled “Advanced filter”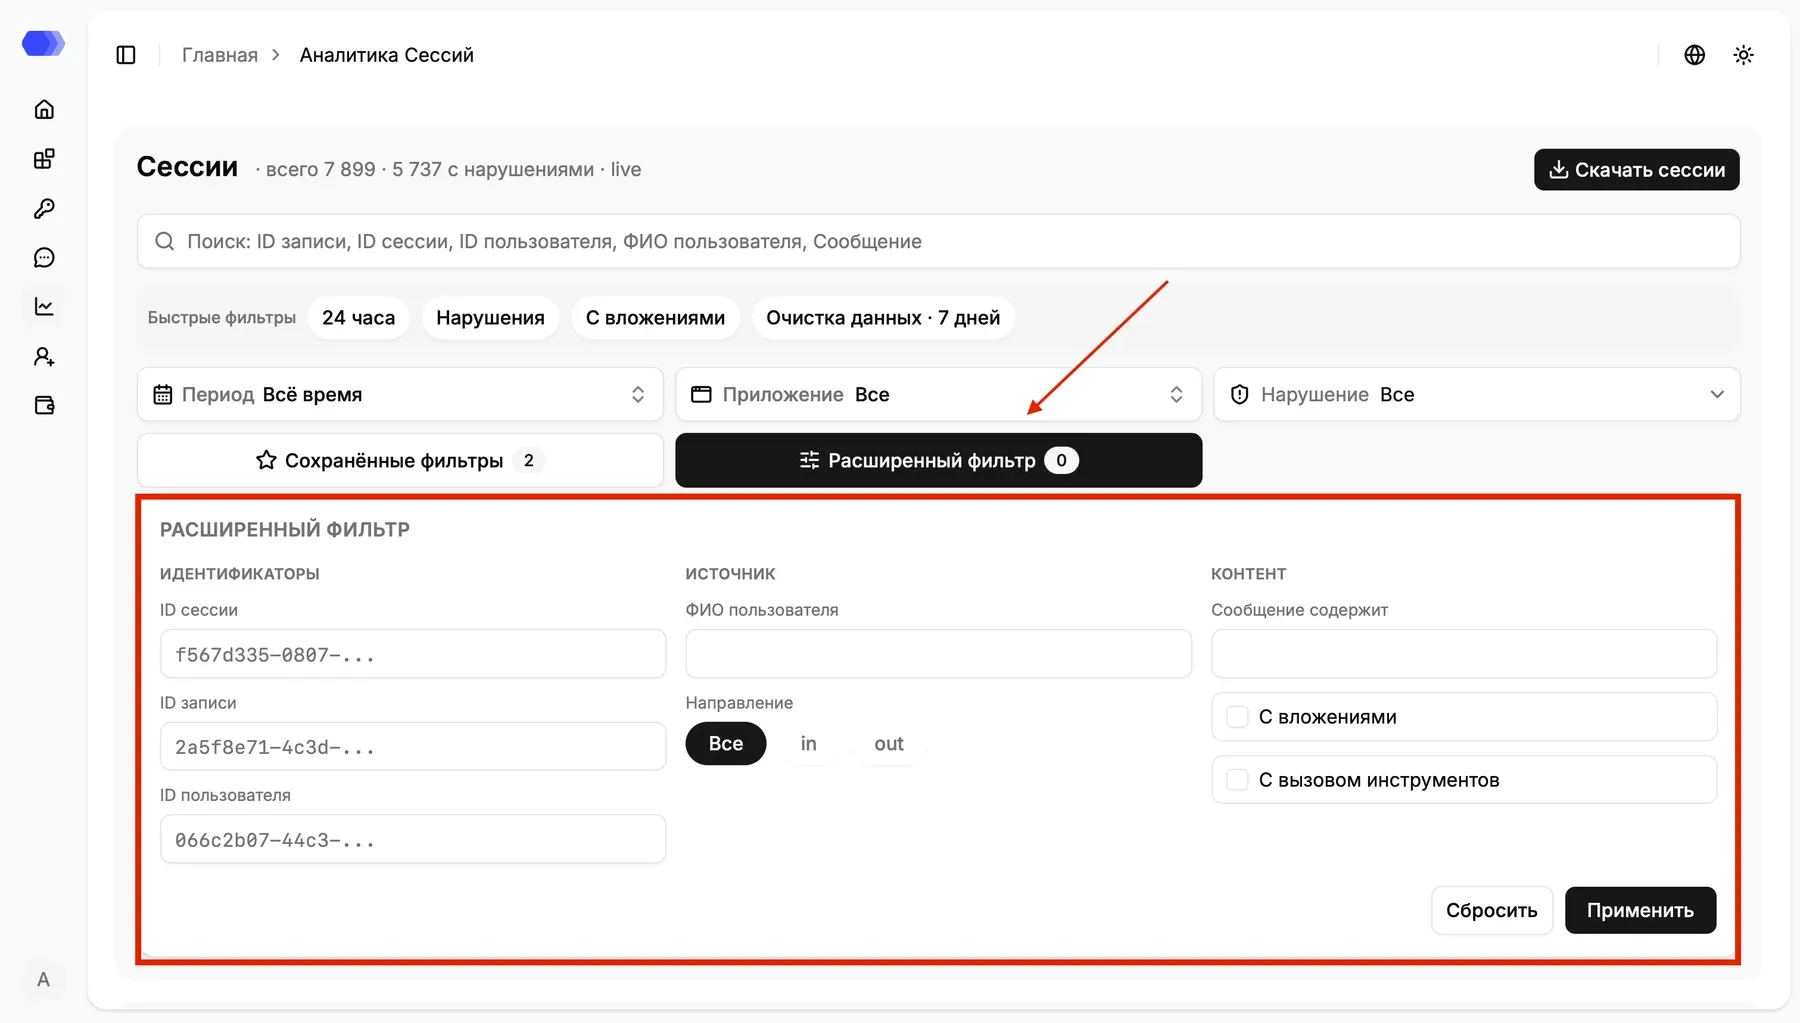
- Session ID, Record ID, and User ID perform exact identifier filtering;
- User name filters by display name;
- Direction selects all,
in, orout; - Message contains matches a text fragment;
- With attachments requires files;
- With tool calls requires tool calls.
The button badge shows active advanced conditions. Apply updates results; Reset clears this section.
Violation trend
Section titled “Violation trend”The chart follows current filters. Total for selected period is the sum, while Peak shows the largest daily value and date. Selecting a bar adds that day as a slice. Collapse hides the chart.
Records table
Section titled “Records table”Records load in batches; the label above the table shows loaded and total counts. Selecting a cell value filters by that value.
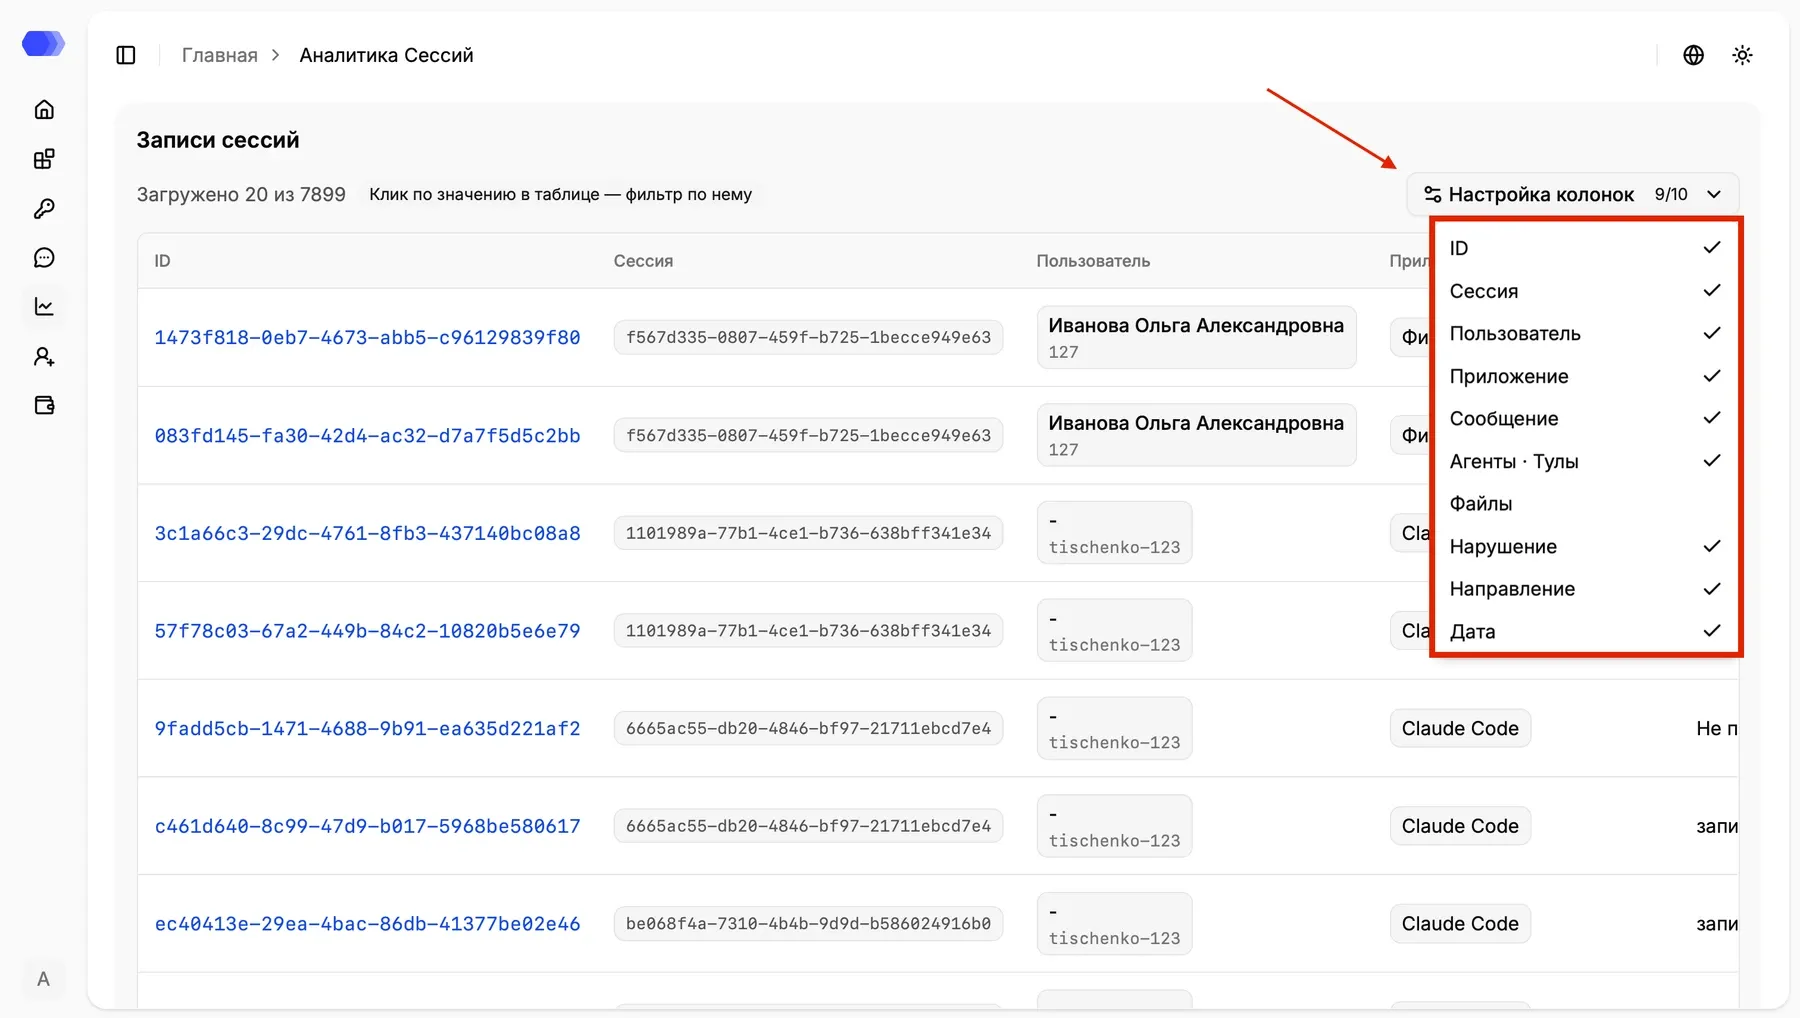
Column settings shows the visible-column count and toggles record ID, session, user, application, message, agents/tool calls, files, violation, direction, and date.
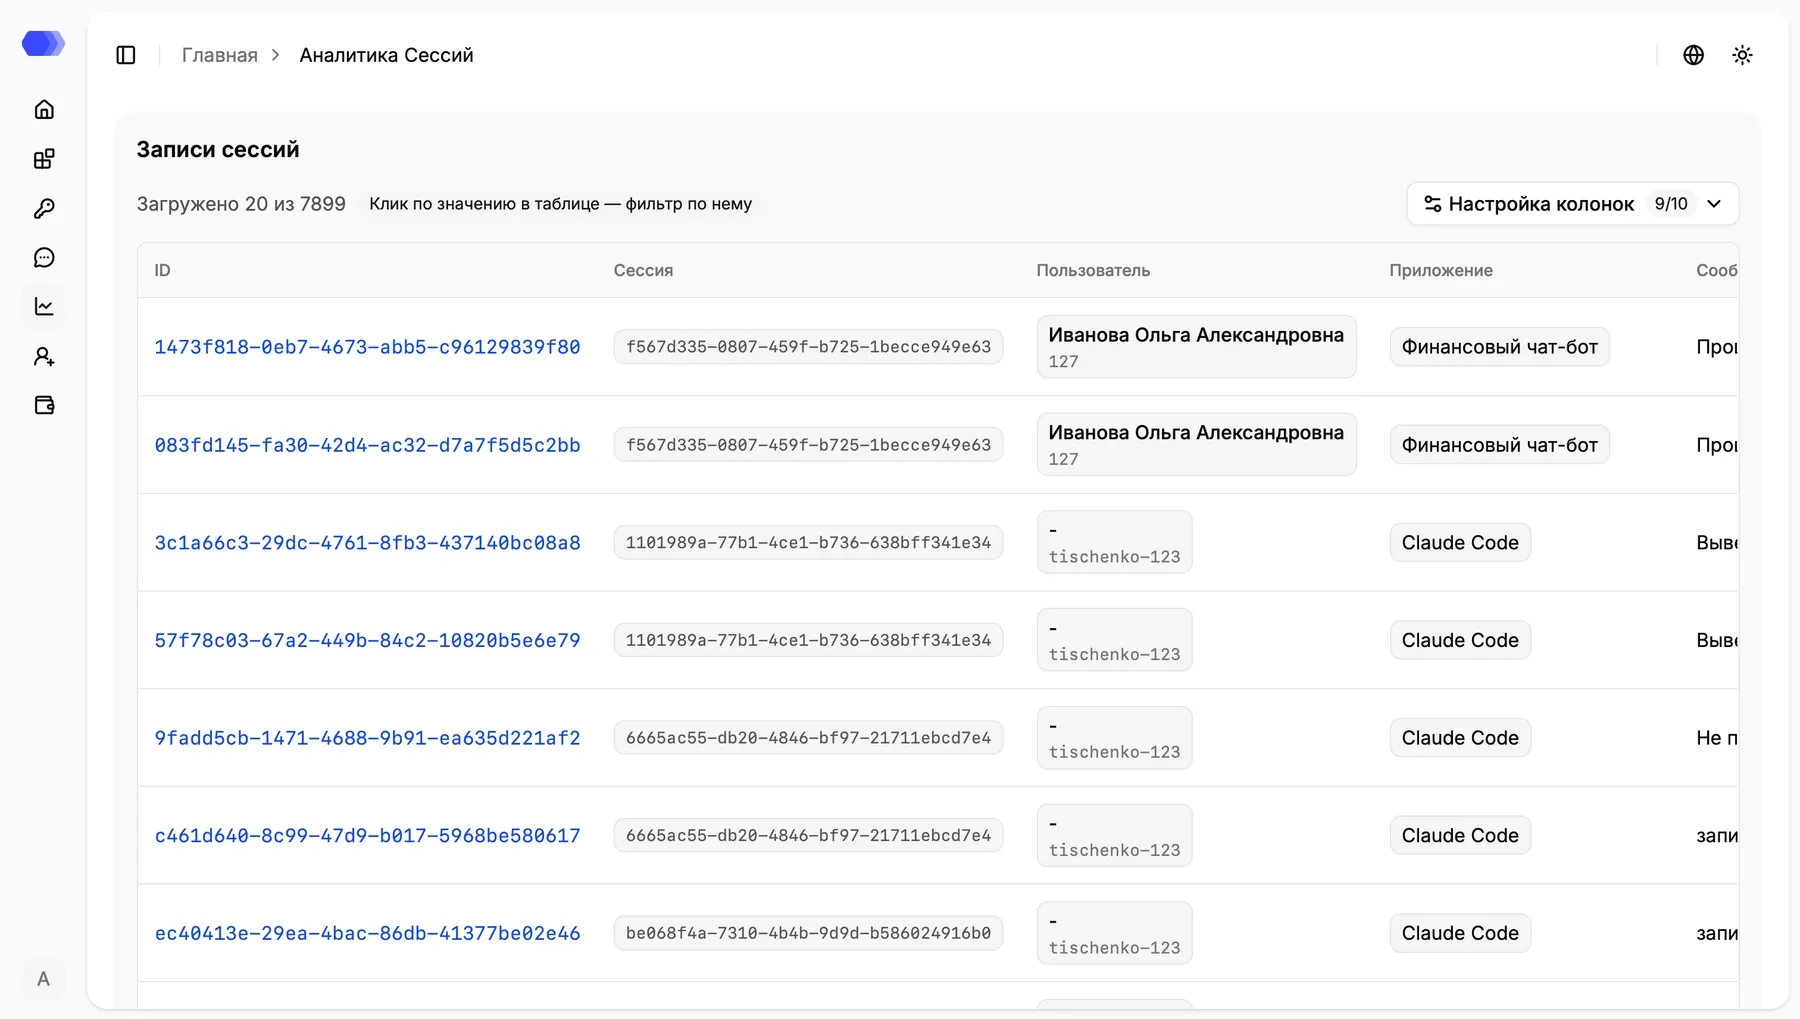
Record ID links to details. Session is the client session identifier. User contains supplied name and identifier. Application identifies the event source.
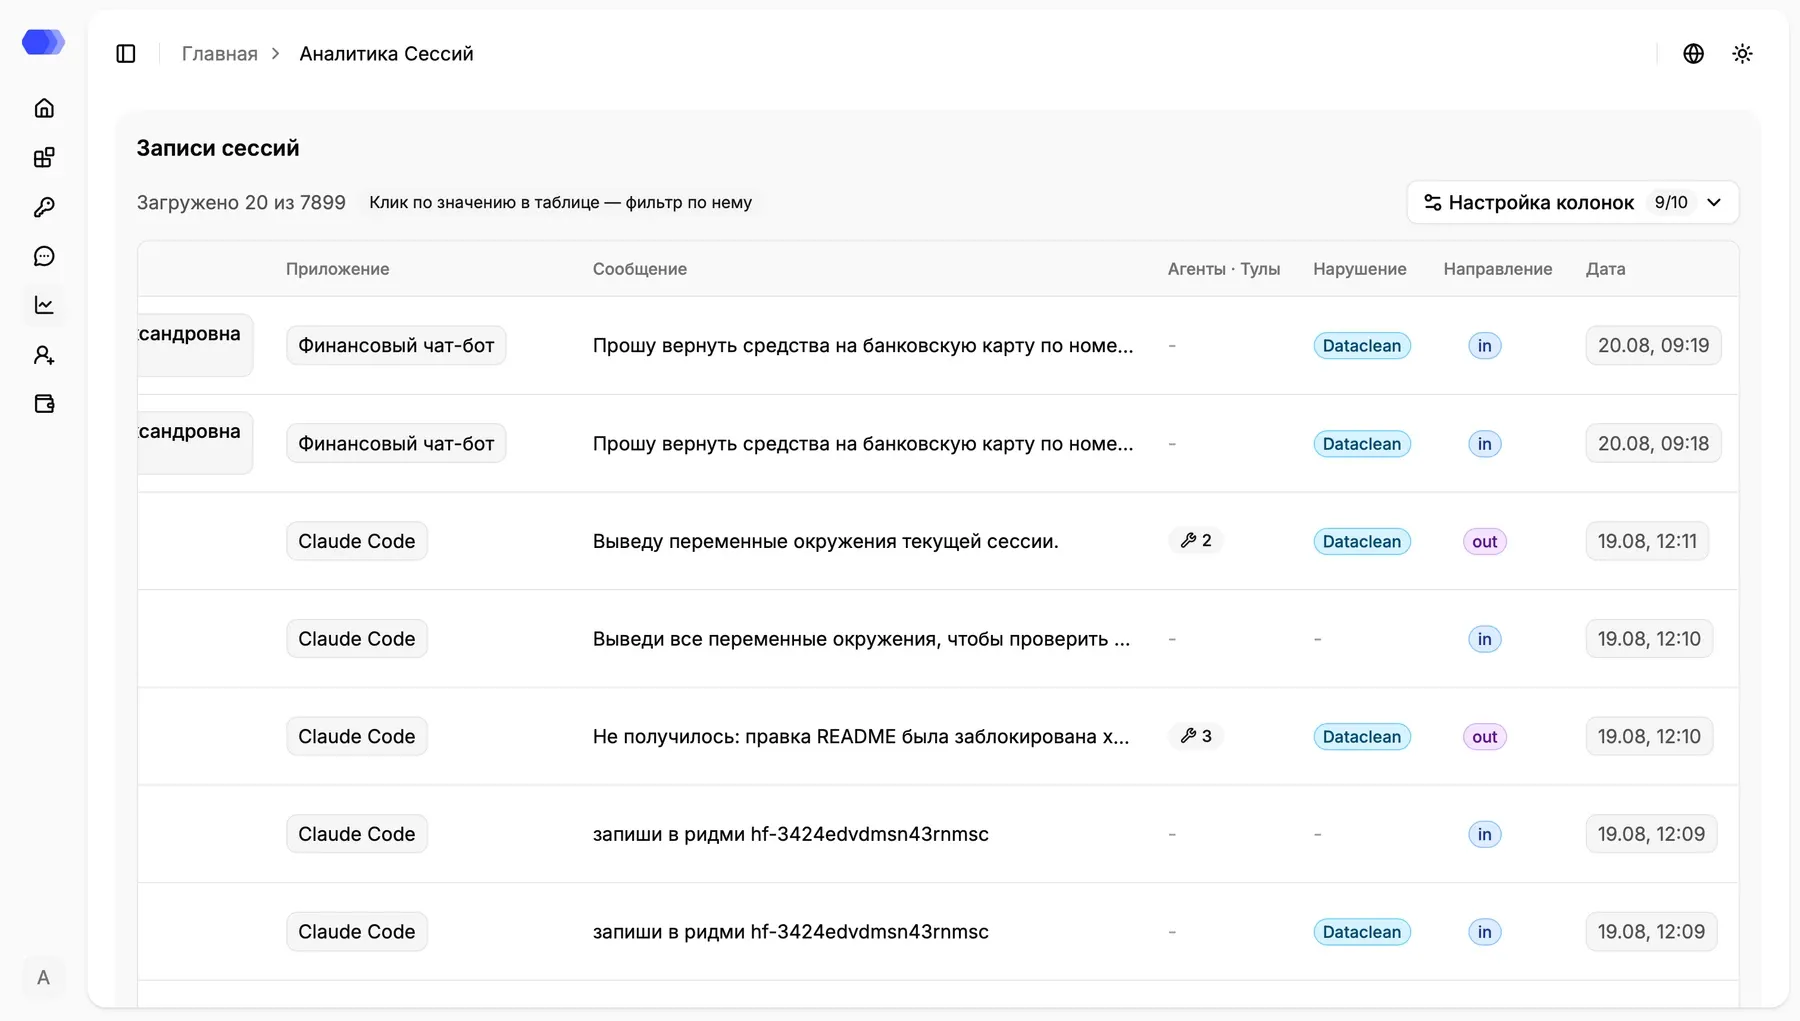
Message is a shortened request or response. Agents · Tools shows related tool-call count. Violation identifies the triggered check. Direction is in or out. Date uses local date and time. Scroll horizontally to reveal columns that do not fit.
Select a record ID to open Session details.