

Dashboard
The Dashboard opens after sign-in and summarises HiveTrace traffic. Message and token metrics update as new data arrives without requiring a page reload.
Summary metrics and charts
Section titled “Summary metrics and charts”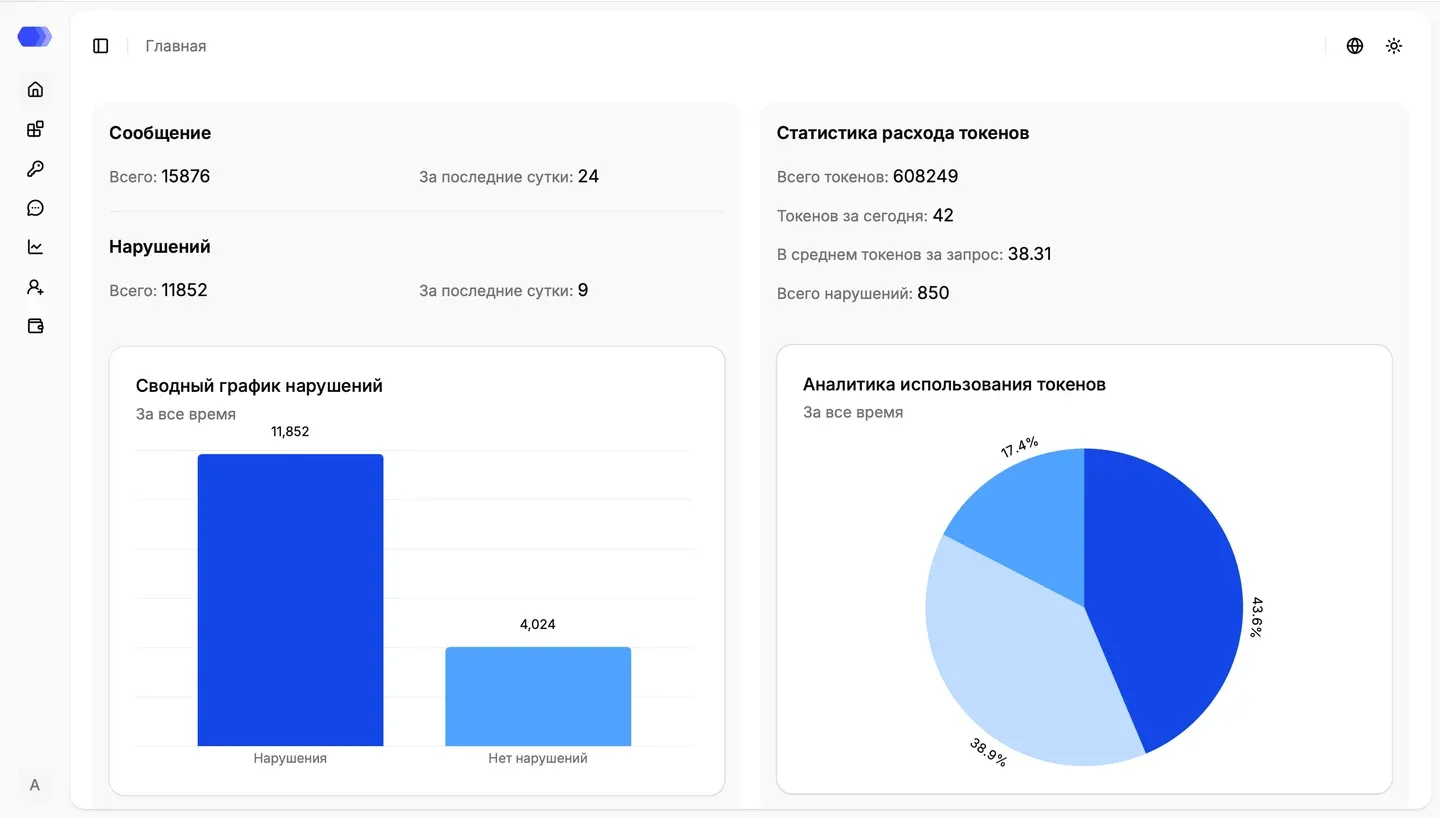
Messages
Section titled “Messages”- Total — requests and responses recorded over all time.
- In the last 24 hours — messages received during the latest rolling 24-hour period.
If traffic is expected but the daily value does not change, check the API token, application, and integration method.
Violations
Section titled “Violations”- Total — messages for which at least one safety check triggered.
- In the last 24 hours — violating messages during the latest 24 hours.
- Violation summary chart — compares messages with and without violations.
The metric counts messages rather than triggered rules; one message can contain multiple violations. Hover over a bar for its category and exact count. The chart period is fixed to All time in version 4.3.
Token consumption statistics
Section titled “Token consumption statistics”- Total tokens — total recorded token consumption.
- Tokens today — consumption since the start of the current calendar day.
- Average tokens per request — average consumption per request.
- Total violations — number of token-threshold violations.
- Token usage analytics — percentage distribution of
low,high, andcriticalviolations.
The pie chart shows violation severities, not the ratio of prompt to completion tokens. Hover over a segment for its severity and share. Its period is fixed to All time in version 4.3.
Latest alerts
Section titled “Latest alerts”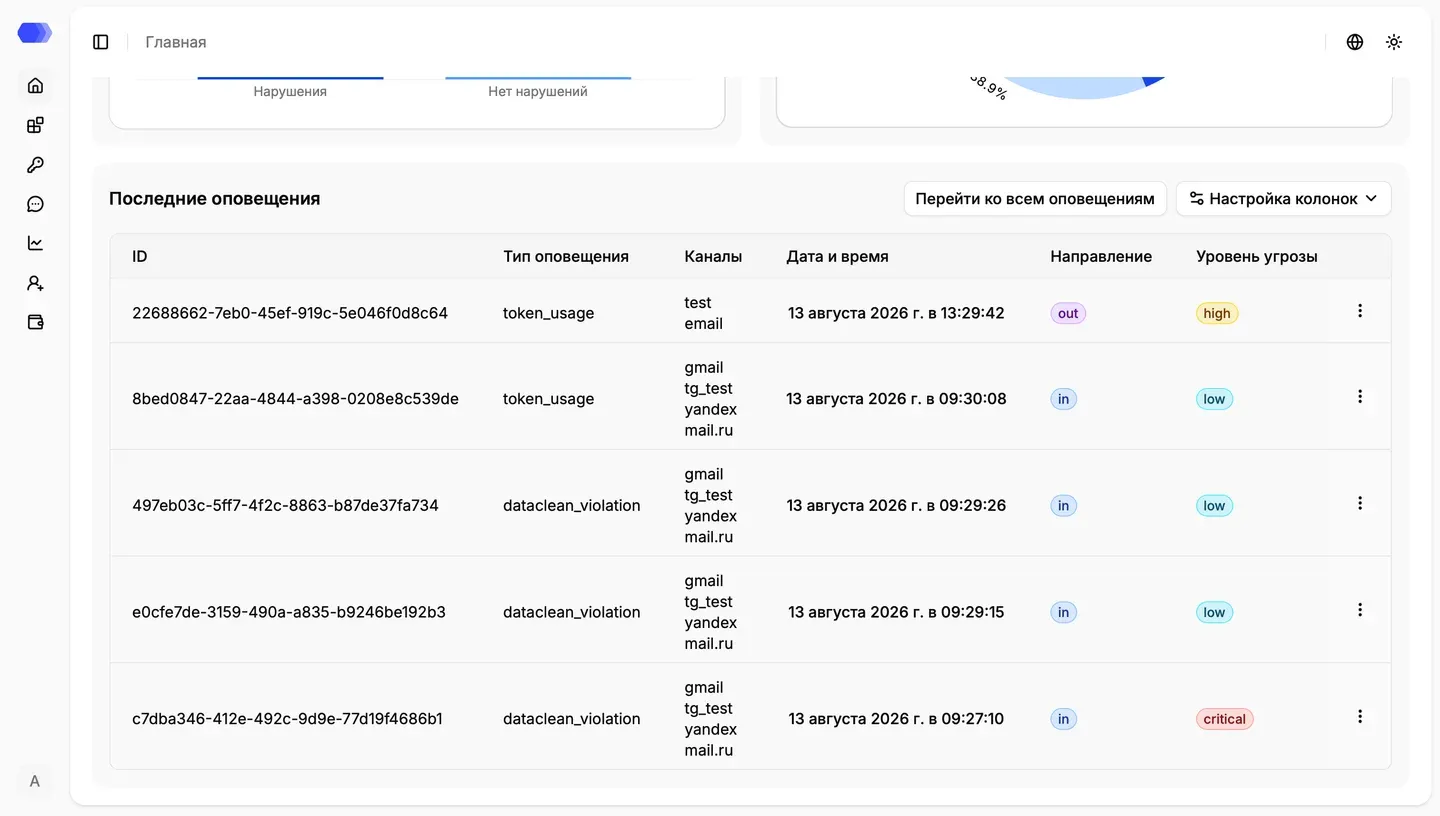
- ID — unique alert identifier.
- Alert type — trigger, such as token usage or a DataClean violation.
- Channels — configurations through which the notification was sent.
- Date and time — creation time.
- Direction —
infor a user request oroutfor an LLM response. - Severity —
low,high, orcritical. - Row menu — actions for the selected alert.
Go to all alerts opens the complete alert log. Column settings hides or restores columns; it does not delete data or change alert configurations.
Review workflow
Section titled “Review workflow”- Compare the latest 24-hour metrics with normal traffic.
- Assess the share of violating messages.
- Review token-violation severity distribution.
- Inspect recent alerts, starting with
criticalandhigh. - Open the full alert log or session analytics for investigation.
Values in the screenshots are example dev-environment data and are not recommended thresholds.