

Budget and cost
The admin-only Budget page shows LLM load in requests and tokens. Use it to identify which application, model, or user produces most of the traffic.
Usage summary
Section titled “Usage summary”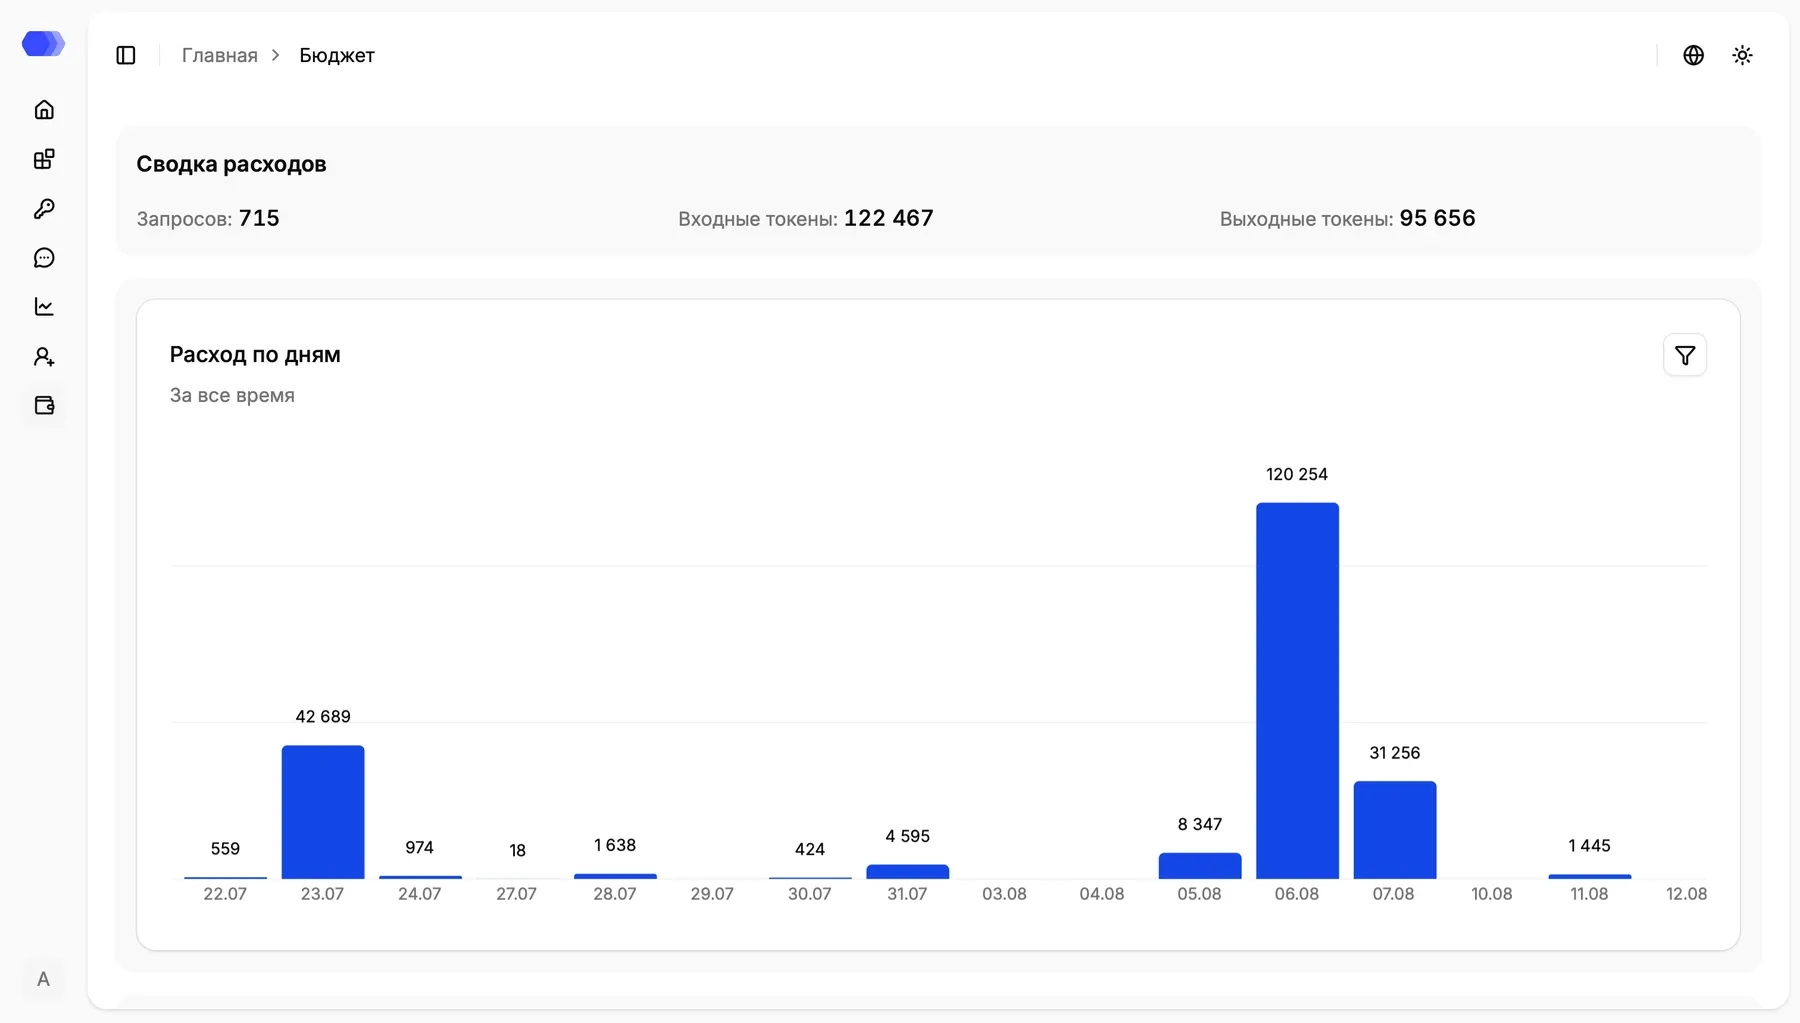
The top card shows totals for the selected period:
- Requests — number of processed model requests;
- Input tokens — tokens sent to models in prompts;
- Output tokens — tokens returned in model responses.
The Daily usage card visualizes consumption over time. Its subtitle states the active period, such as All time; dates appear on the horizontal axis, and each bar has its value above it. A day with no consumption may have no visible bar.
Click the funnel in the chart’s upper-right corner to open filters. Restrict the data by date range and application. Applying a selection refreshes the summary, chart, and every table below; reset restores all-time data.
By application and model
Section titled “By application and model”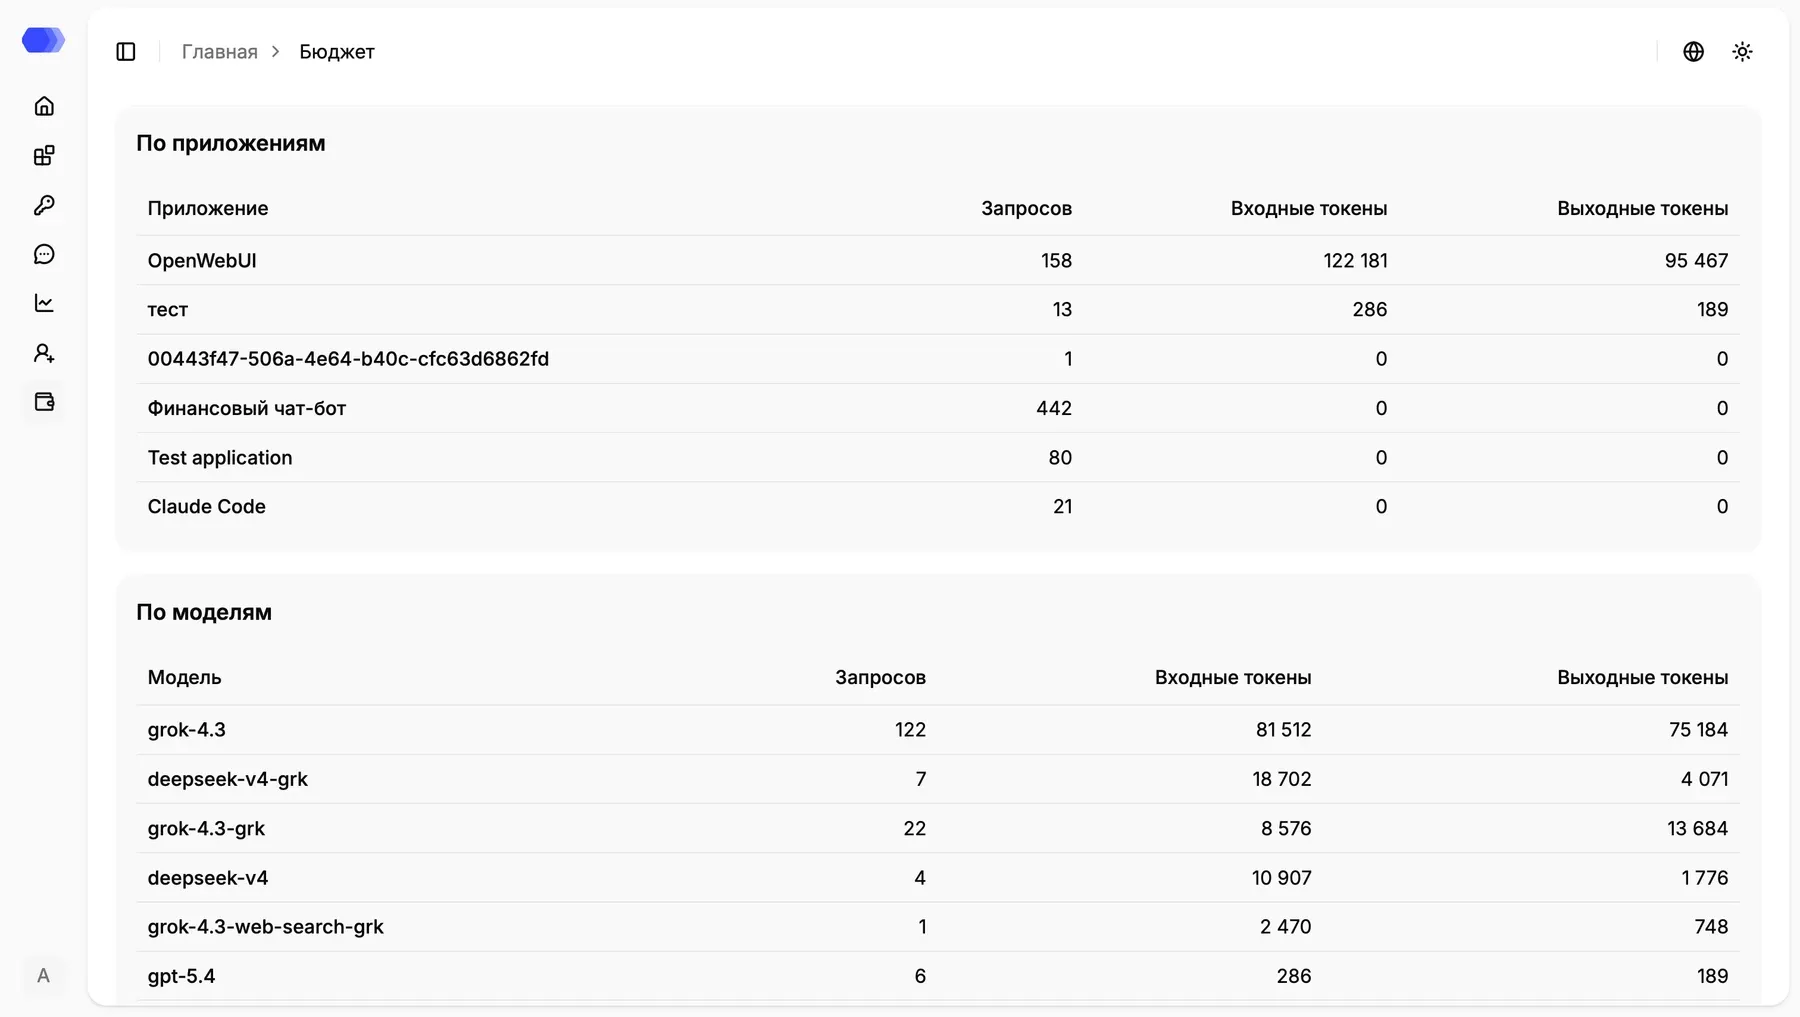
By application helps identify the integration producing most of the load. Each row contains its request count, input tokens, and output tokens. An identifier can appear instead of a friendly name when no display name was available for the application.
By model groups the same metrics by the model name supplied by the integration. Compare request count and token volume together: a few long requests can consume more tokens than many short requests.
By user
Section titled “By user”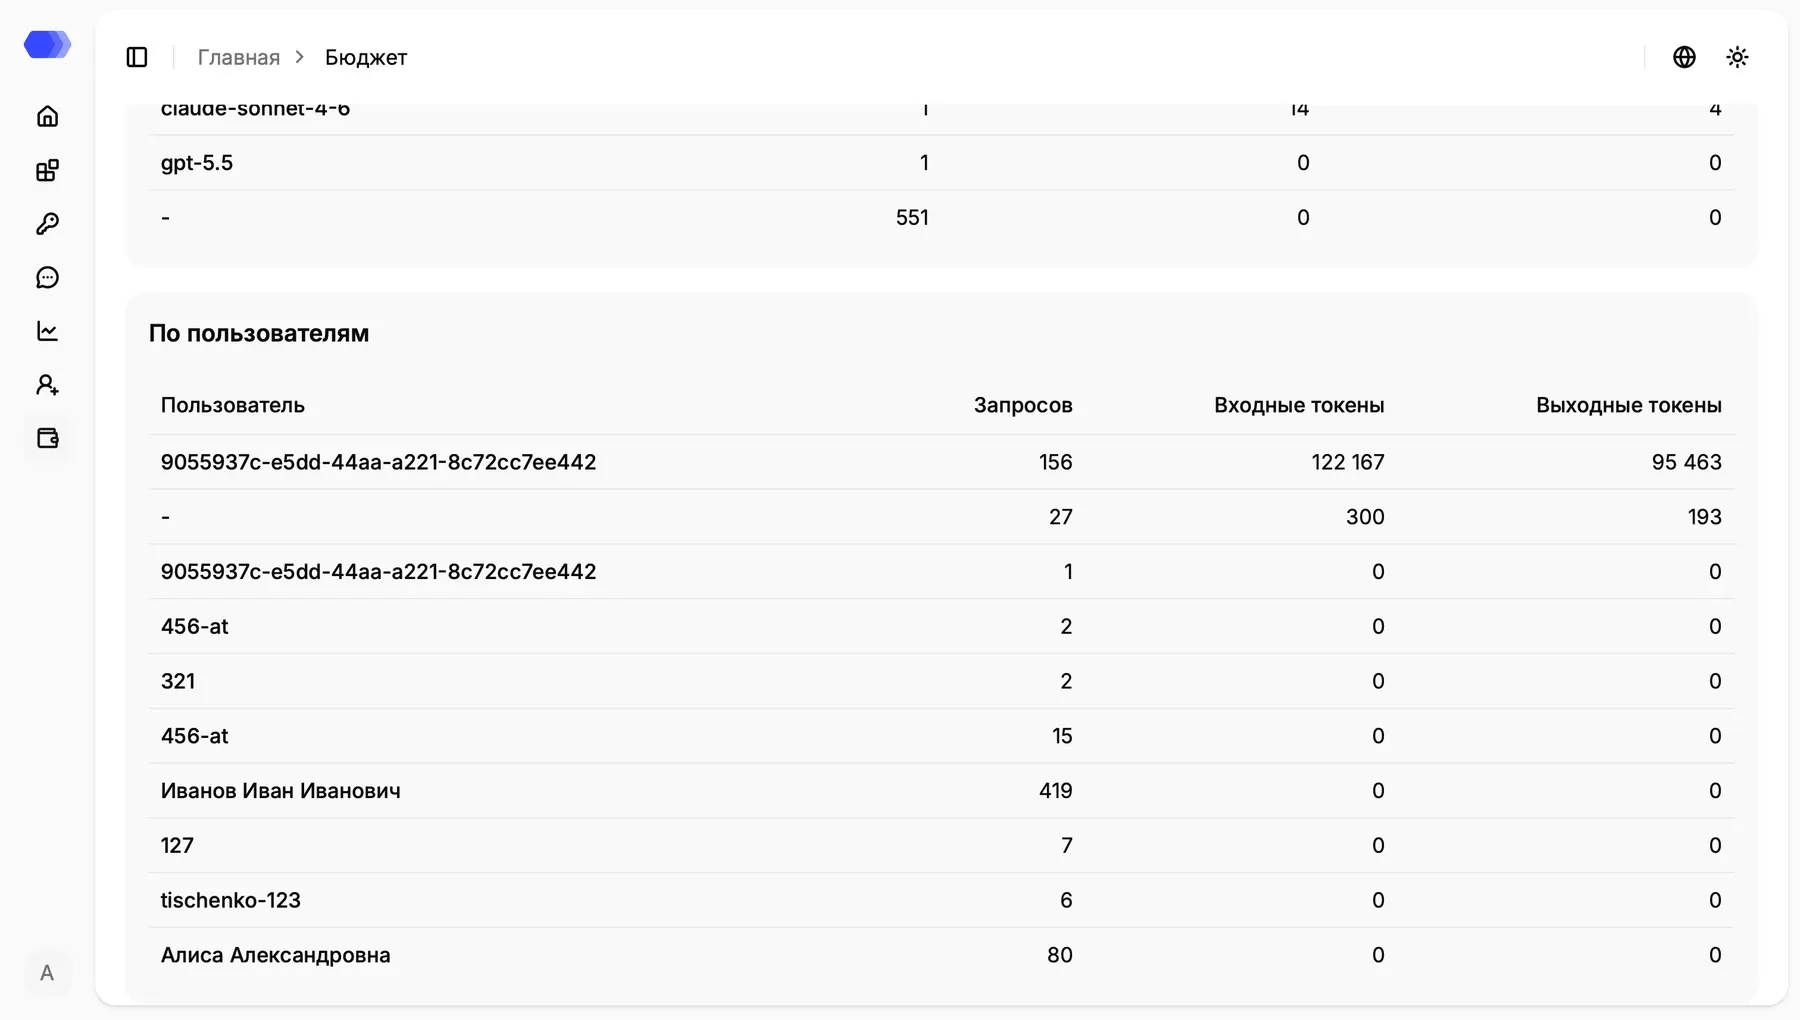
The final table attributes load to users. Its first column can contain a full name, external identifier, or internal ID, depending on what was available at processing time. A dash means the requests could not be associated with a specific user.
All three tables use the same Requests, Input tokens, and Output tokens metrics. A non-zero request count with zero tokens means token statistics were not supplied or recorded for those entries.
Analysing usage
Section titled “Analysing usage”- Open the filters in Daily usage.
- Select a start date and end date, and optionally one application.
- Apply the filters and verify the displayed period below the chart title.
- Identify peak days.
- Use the application, model, and user tables to locate the source of the load.
An empty table means that no data matches the current conditions. Version 4.3 reports usage but does not calculate monetary cost or provide an export action.